Mind the Differences in Error Metrics
Understanding Error Metrics in Time Series Forecasting: Mean vs Median
In time series forecasting, evaluating the performance of a model often involves choosing an appropriate error metric. A subtle yet critical distinction often overlooked is that error metrics based on squared errors (e.g., Mean Squared Error (MSE), Root Mean Squared Error (RMSE)) optimise for the mean, whereas metrics based on absolute errors (e.g., Mean Absolute Error (MAE), Mean Absolute Scaled Error (MASE)) optimise for the median.
This difference is fundamental and has practical implications, particularly when the underlying data distribution is skewed.
Key Insight
For symmetric distributions, the mean and the median are besties—they coincide! But for skewed distributions, they can be worlds apart. Here’s the scoop:
-
Squared Errors (e.g., MSE, RMSE):
These metrics love to punish large deviations. They focus on the mean, which can be swayed by outliers like a leaf in the wind. 🍃 -
Absolute Errors (e.g., MAE, MASE):
These metrics are the cool, calm, and collected type. They focus on the median, staying steady even when outliers try to crash the party. 🎉
Illustrative Example
Symmetric Distribution
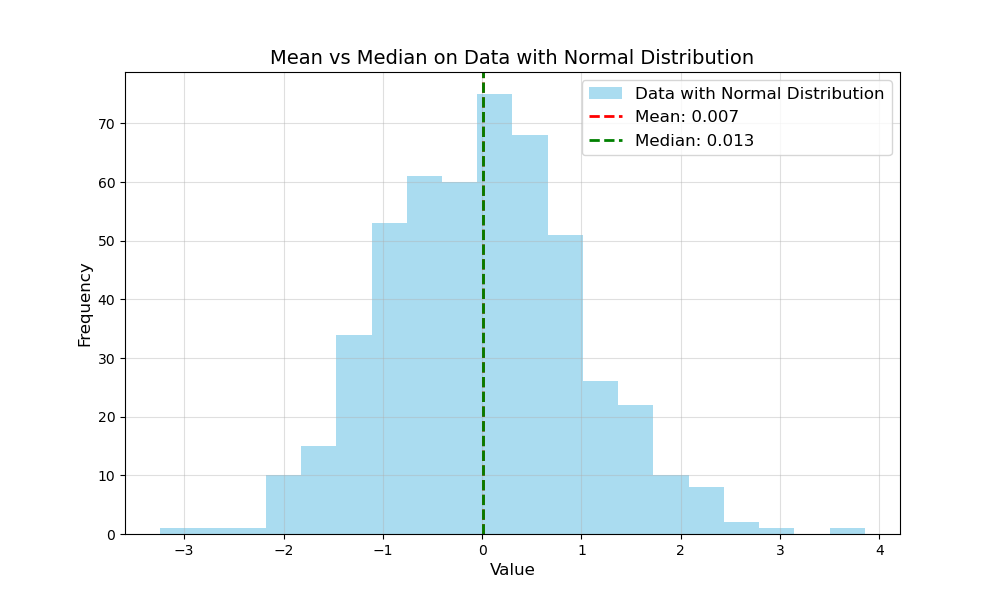
Imagine a perfect world where data is symmetric (think Gaussian without outliers). Here, the mean and median are practically twins, and both metrics give you similar results.

Skewed Distribution with Outliers
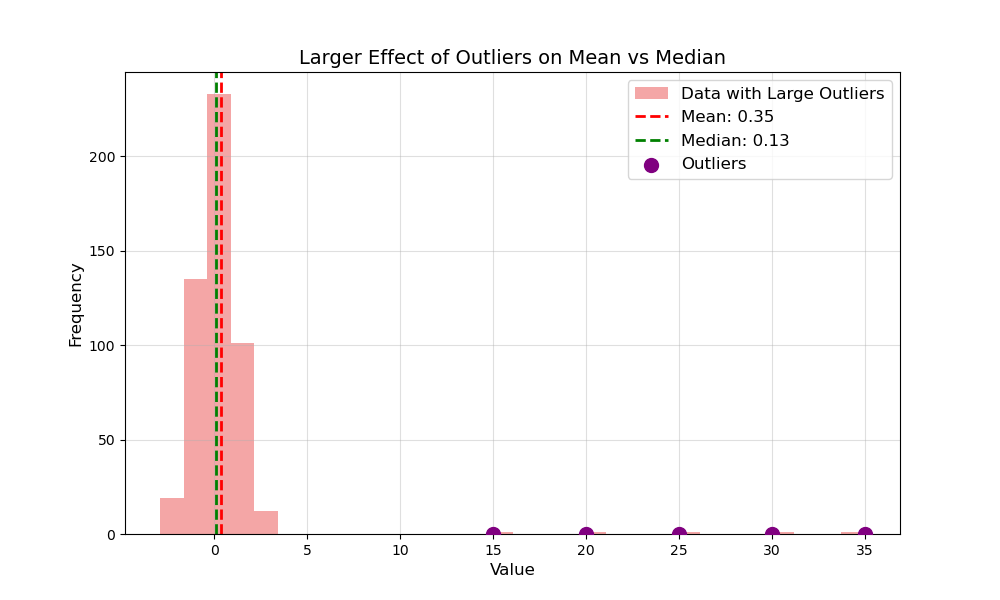
Now, picture a dataset with some wild outliers. The mean gets pulled toward these outliers, while the median stays chill. This makes squared-error metrics reflect the outliers’ influence, while absolute-error metrics remain unfased.

- Red Line: The mean, swayed by outliers.
- Green Line: The median, staying true to the main data.
- Purple Points: Outliers causing the drama.
Practical Implications
- When to Use Squared Errors:
Go for MSE or RMSE when:- You want to heavily penalise large deviations.
- Your data is symmetric, or outliers are rare.
- When to Use Absolute Errors:
Choose MAE or MASE when:- You need robustness against outliers.
- Your data is skewed or has extreme values.
Understanding these differences helps you pick the right error metric based on your data’s quirks and your forecasting goals. Whether you’re optimising for the mean or the median, the right choice can lead to better insights, especially with skewed or noisy data. Happy forecasting! 📈
References
- Hewamalage, H., Ackermann, K., & Bergmeir, C. (2023). Forecast Evaluation for Data Scientists: Common Pitfalls and Best Practices. Data Mining and Knowledge Discovery